Retrieving a Time Series
The Python Code snippet 1 shows how to retrieve a MODIS time series for the location with longitude = -54 and latitude = -12 during the period of 01-01-2001` to ``12-31-2001 for the product MOD13Q1:
1 2 3 4 5 6 7 8 9 10 11 12 13 14 15 16 17 18 19 20 21 22 23 24 25 26 | import matplotlib.pyplot as plt
from wtss import wtss
w = wtss('https://brazildatacube.dpi.inpe.br/')
ts = w.time_series(coverage='MOD13Q1-6', attributes=('red_reflectance', 'NIR_reflectance'),
latitude=-12.0, longitude=-54.0,
start_date='2001-01-01', end_date='2001-12-31')
fig, ax = plt.subplots()
plt.title('Time Series MOD13Q1', fontsize=24)
plt.xlabel('Date', fontsize=16)
plt.ylabel('Surface Reflectance', fontsize=16)
ax.plot(ts.timeline, ts.red_reflectance, color='red', ls='-', marker='o', label='red')
ax.plot(ts.timeline, ts.NIR_reflectance, color='purple', ls='-', marker='o', label='nir')
plt.legend()
plt.grid(b=True, color='gray', linestyle='--', linewidth=0.5);
fig.autofmt_xdate()
plt.show()
|
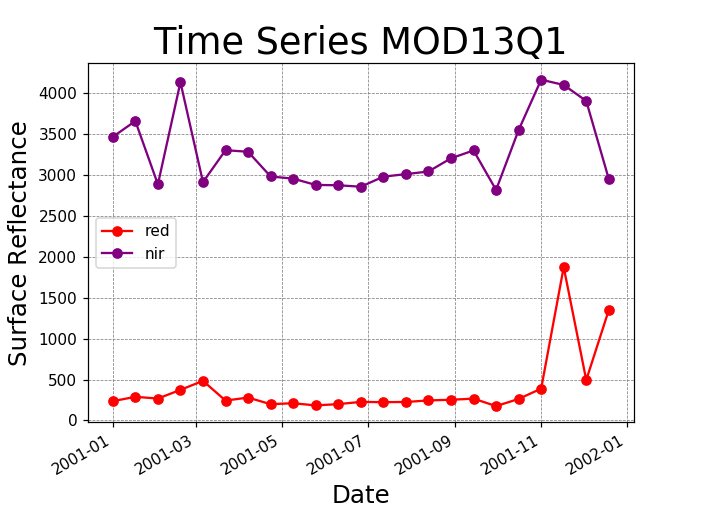
The output of the above code snippet is a time series chart as shown in Figure 4:

Figure 4 - MOD13Q1 Time Series Plot.